FLARE FireOutlook
Twenty days of
western fire weather
A look at the major fires that appeared across the West in July 2026: how vegetation and weather changed beforehand, what FLARE FireOutlook showed one day ahead, and how those outlooks compared with the areas that later burned.
July 1–20, 2026
Visitors: 0
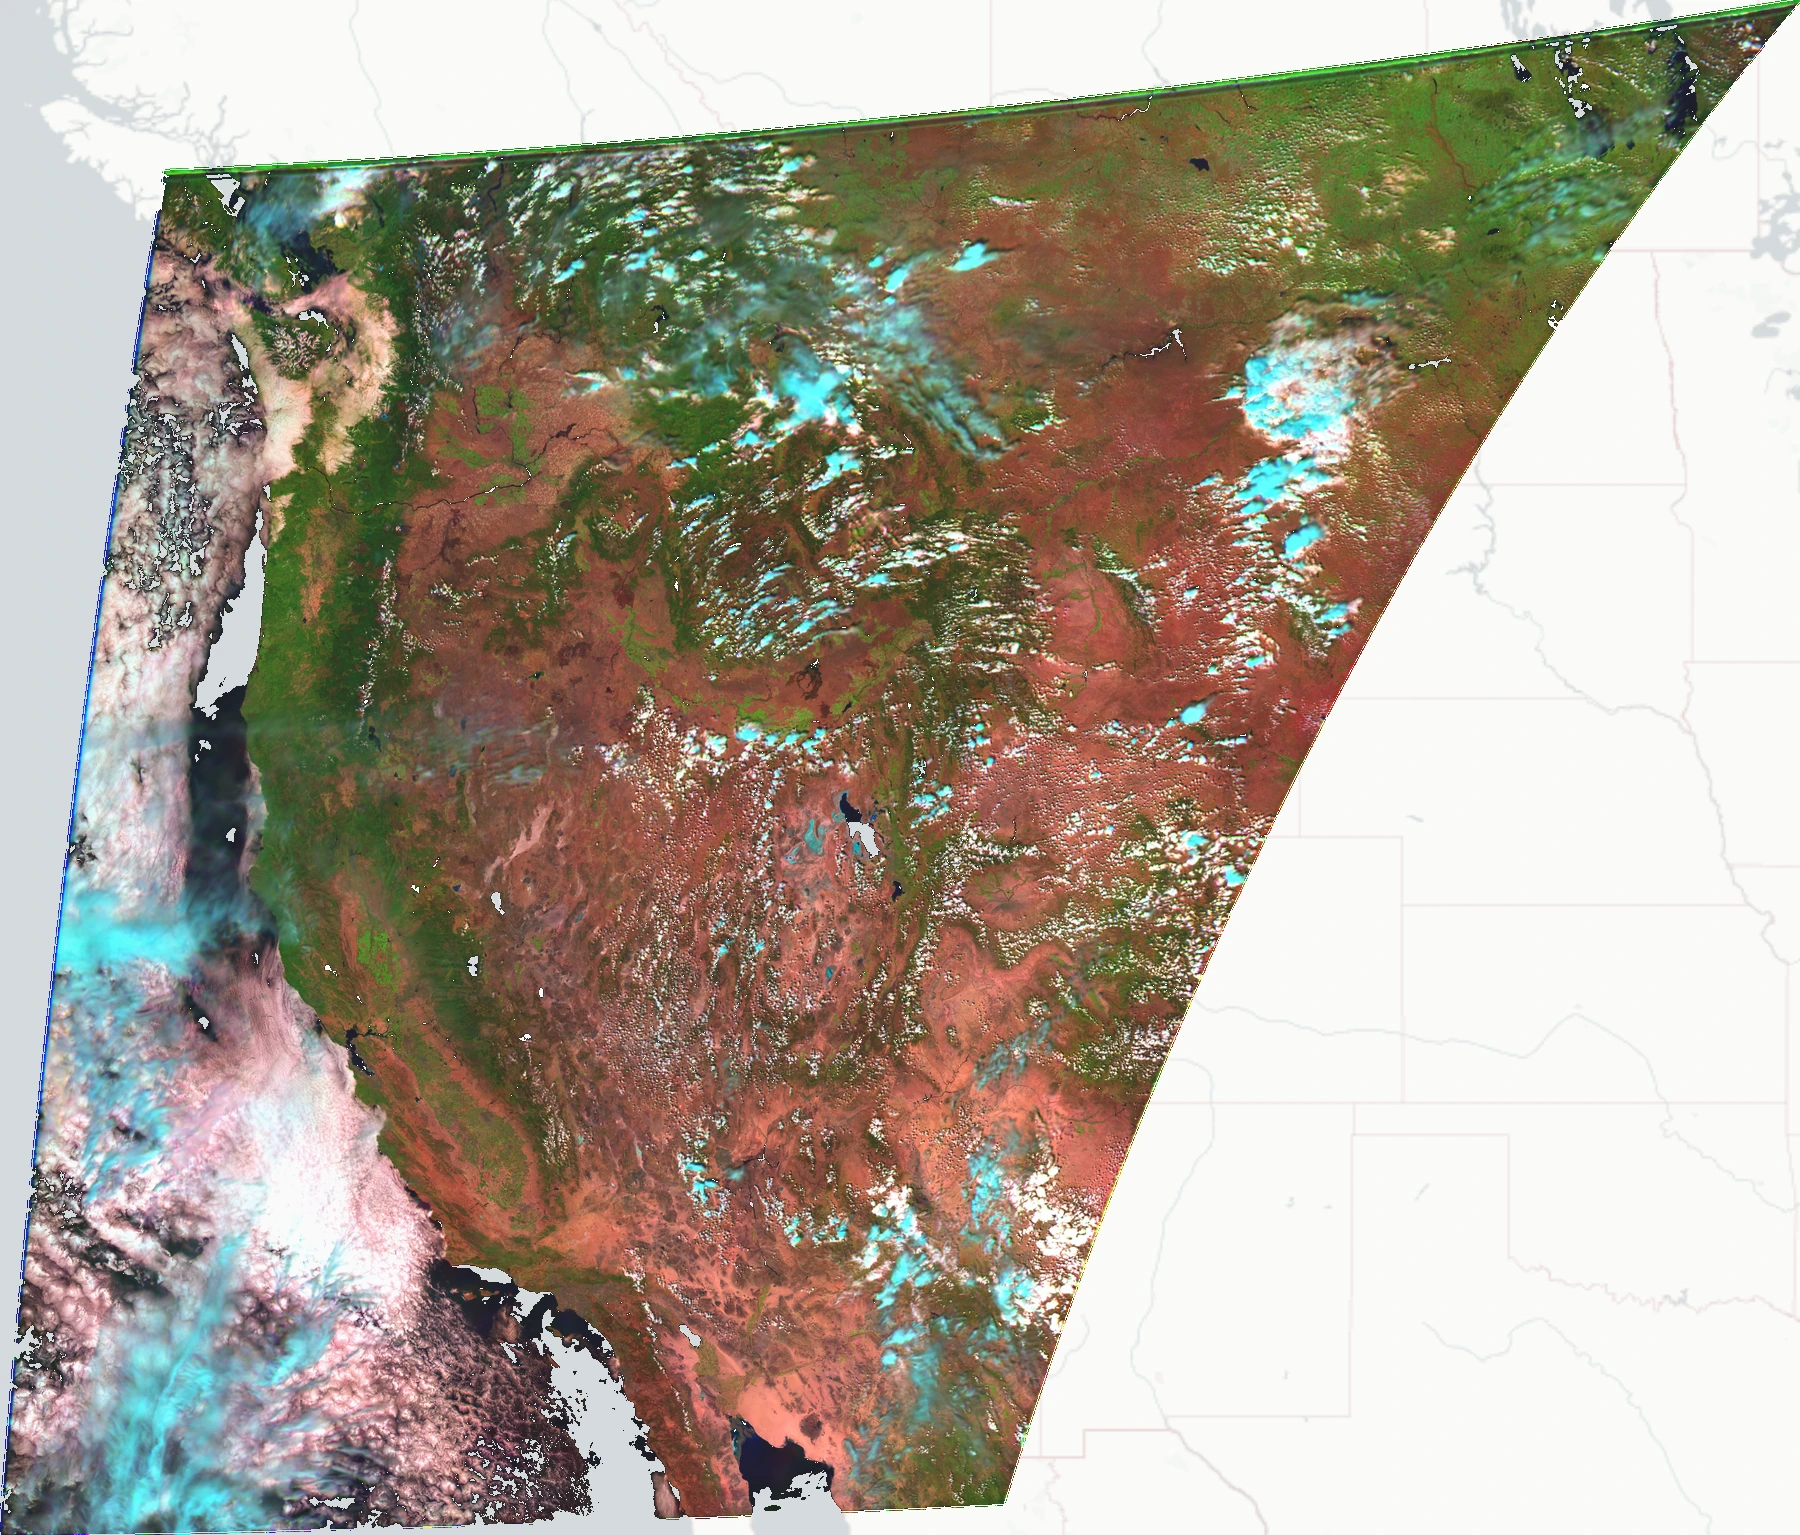
FLARE’s false-color view of the West. Healthy vegetation appears green. Drier land appears rust or rose, while clouds and snow appear pale blue. The outlines trace major fires as they were mapped.
What happened
The fires did not arrive all at once.
Twenty major fires or fire complexes first reported between July 1 and 20 eventually grew beyond 10,000 acres. The largest number were first reported on July 16. During the week before they appeared, vegetation became less green (NDVI lowered) at 15 fire locations, while the vegetation moisture signal declined (NDMI reduced) at 13. A day ahead FireOutlook (forecast) for 11 of those locations were rated High, Very high, or Extreme.
01 · Fires across the West
Before the Stookey Fire, the danger was already building
About 70 miles southwest of Salt Lake City, the ingredients for a fast-moving wildfire were coming together.
At noon MDT on July 8, FLARE classified the area where the Stookey Fire would later emerge as facing High fire danger the next days outlook. By noon on July 9, the outlook for July 10 had risen to Very High. Temperatures were expected to approach 95°F, relative humidity to fall to about 6%, and no rain was forecast. The surrounding landscape was already marked by dry fuels and Extreme Drought.
FLARE placed the day’s most dangerous convergence of conditions at about 5:00 p.m. MDT. WFIGS recorded the fire’s discovery at 5:23 p.m. By late the following morning, its mapped perimeter encompassed 348 acres. By the evening of July 14, the fire had grown to a reported 11,881 acres.
Use the Back, Play, and Next buttons to follow the first 20 days of July. The left map shows fires mapped through each date; the right map shows FLARE’s outlook for that same date, issued the day before. Turn on Fire outlines on FireOutlook to compare where fires ultimately appeared with the danger conditions that preceded them.
Basemap © OpenStreetMap contributors © CARTO
Basemap © OpenStreetMap contributors © CARTO
02 · July 15–18
See how FireOutlook changed from one day to the next.
FLARE uses five-minute GOES observations to produce physics-derived NDVI and NDMI on a fine western grid. Grid spacing ranges from about 260–470 meters east-west and 319–778 meters north-south. NDVI shows vegetation greenness, while NDMI shows changes in the vegetation and surface moisture signal. Choose a day, then compare FireOutlook with the day’s FLARE vegetation reconstruction. Drag the divider across the map to see where the patterns align.
The left side shows vegetation conditions on the selected day. The right side shows the FireOutlook made the evening before for that day.
03 · Hot, dry and windy
What did the toughest hour look like?
For each fire location, FLARE found the hour when heat, dry air and wind were strongest together. Every value in the chart comes from that same place and time. Vapor pressure deficit (VPD) measures the drying demand of the air: higher values mean the air can draw moisture from vegetation more quickly.
04 · The week before
How did vegetation change before each fire?
Each fire has two bars showing the previous seven days. Bars pointing left mean greenness or moisture fell. Bars pointing right mean it rose. Use the slider or choose a row to read one fire at a time.
05 · Fire growth and FireOutlook
Did higher FireOutlook values line up with where the fire grew?
Watch each fire’s mapped outline grow across real terrain. The colored surface shows FireOutlook before each new area was mapped. Orange marks the land added next.
Choose a fire and move through its mapped growth.
You can make the terrain look taller to see slopes more clearly. This changes only the picture, not the calculations. The fire outlines are snapshots from different times, so they show change between reports rather than every movement of the fire edge.
06 · Fire list
All 20 major fires.
Browse the fires without counting one twice when it belongs to a larger fire complex.
07 · A fair test
We made every FireOutlook before checking what happened.
- 01
Build a daily view of the land
FLARE turned daytime observations into 3,154 detailed views, removed clouds and bad data, and combined them into 36 daily maps.
- 02
Use only information available beforehand
Each FireOutlook used a weather forecast that had already been made. Weather reported later never entered the outlook.
- 03
Choose the danger levels before July
We set the FireOutlook levels using conditions from June 22 through 30. July fires played no part in choosing them.
- 04
Finish the outlooks before opening fire records
We completed all 36 daily FireOutlooks and stored unchanged copies before looking at fire maps or reports.
- 05
Check them against what happened
We then compared FireOutlook with official fire reports, changing fire maps and heat detections from satellites.
What to keep in mind
Final acreage comes from later reports and never entered FireOutlook. A fire complex and its component fires are not added together. FLARE’s vegetation maps are detailed daily estimates built from satellite observations rather than raw satellite images. FireOutlook shows where weather, vegetation and fuels were more supportive of fire; it does not predict where an ignition will occur.